Free Market Research for Australian Businesses: The Sources We Actually Use
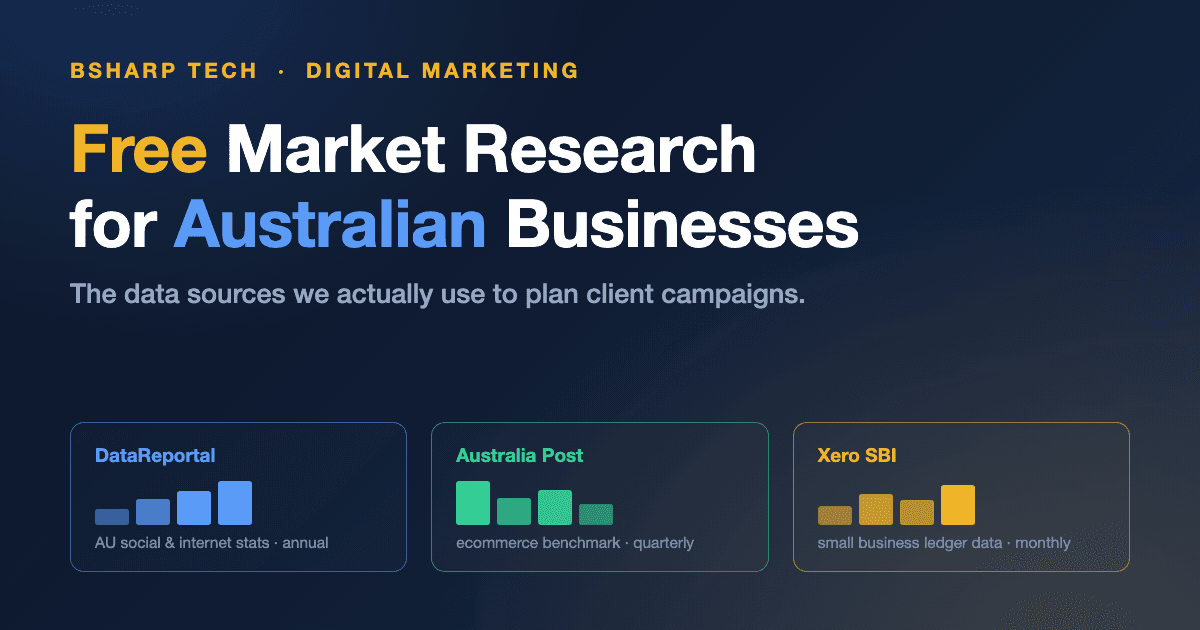
Good marketing decisions start with good data, but commissioned research costs more than most small businesses spend on marketing in a year. The good news? Australia is unusually well served by free, credible data sources — if you know where to look.
This is the exact list we work from when planning client campaigns at BSharp Tech: bank spending trackers, government statistics, industry benchmarks and AI adoption studies, organised by the kind of business you run. Bookmark it — we keep it current, and every source here is free (a few ask for an email address).
Key takeaways
- For Australian social media and internet stats, DataReportal’s Digital Australia report is the best free replacement for the discontinued Sensis/Yellow Social Media Report.
- Bank data beats surveys for speed — CommBank’s spending tracker draws on de-identified data from 7 million customers and lands ahead of official ABS figures.
- You only need a simple habit: three sources monthly, one quarterly, a handful annually. The cadence chart below shows which.
Which Free Data Sources Work for Any Australian Business?
Start with four: DataReportal for digital behaviour, the ABS for official spending and industry data, a bank spending tracker for timing, and Think with Google for search trends. Between them, they’ll answer most “what are Australians actually doing?” questions that come up in marketing planning.
| Resource | Why it’s useful |
|---|---|
| Digital 2026: Australia DataReportal · annual + quarterly updates | Australian internet, social media and device usage stats. The definitive free source since the Yellow Social Media Report ended. |
| Think with Google (APAC) Google · ongoing | Consumer insights and search trend data you can drop straight into a strategy document. |
| ABS statistics Australian Bureau of Statistics · monthly/quarterly | Official household spending, business counts and industry data. Note: the monthly Retail Trade series ended mid-2025 — use the Monthly Household Spending Indicator instead. |
| CommBank Household Spending Insights CommBank · monthly | Spending trends from de-identified data of 7 million customers, released ahead of the ABS figures. |
| CommBank Consumer Insights Report CommBank · periodic | Surveys 5,000+ Australians on how they choose and judge consumer-facing businesses. |
| Westpac IQ & ANZ‑Roy Morgan Consumer Confidence Westpac / ANZ · weekly & monthly | Consumer sentiment indexes. Useful for timing campaigns around consumer mood rather than the calendar. |
Why do we lean on bank data so much? Because it’s behavioural, not aspirational. Surveys tell you what people say they’ll do; transaction data from millions of accounts shows what they actually spent last month, weeks before official statistics catch up.
Which Reports Should Ecommerce and Retail Businesses Watch?
The Australia Post eCommerce Report is the benchmark: real parcel-delivery data broken down by category, generation and location, published annually with quarterly updates. Pair it with NAB’s monthly index and you can see which categories are growing before you commit ad budget.
| Resource | Why it’s useful |
|---|---|
| Australia Post eCommerce Report Australia Post · annual + quarterly | The benchmark for Australian online shopping — who buys what, where, and how it’s changing. |
| NAB Online Retail Sales Index NAB · monthly | Online retail spend by category. Check it before deciding where next quarter’s ad dollars go. |
| ABS Monthly Household Spending Indicator ABS · monthly | The official read on retail spending. |
| Wunderkind APAC Consumer Insights Wunderkind · annual | Australian consumer behaviour by age and gender — cost-of-living pressure, channel fatigue and trust. |
| Capgemini: What Matters to Today’s Consumer Capgemini · annual | How AI, personalisation and emotion shape purchase decisions. |
| Shopify Commerce Trends / Salesforce State of Commerce / Meta Foresight annual · free with email | Global commerce and social-commerce trends with Australian cuts. |
Running paid traffic to an online store? This is the data that stops “set and forget” budgets. When a category softens in the NAB index, we’d rather know in week two than at the end-of-quarter report. It’s also the layer of evidence behind our ads management work.
What About Service Businesses and Trades?
Xero Small Business Insights is the one to bookmark. It’s built from real, anonymised ledger data of Australian small businesses — sales, jobs, wages, payment times and productivity, split by industry. For benchmarking a trades or professional-services client, nothing free comes close.
| Resource | Why it’s useful |
|---|---|
| Xero Small Business Insights Xero · monthly + special reports | Real ledger data from Australian small businesses. Benchmark your sales growth, payment times and wage costs against your industry. |
| CommBank Consumer Insights Report CommBank · periodic | How Australians choose and engage with service providers. |
| Westpac / ANZ consumer confidence weekly/monthly | Demand timing for discretionary services — confidence dips hit “nice to have” services first. |
| Anthropic Economic Index Anthropic · periodic | Real usage data on how AI is applied across occupations — handy when positioning professional services around AI. |
| Microsoft Work Trend Index Microsoft · annual | Workplace and AI adoption trends for B2B messaging. |
| HubSpot / Salesforce State of Marketing annual · free with email | Channel benchmarks and buyer behaviour for services lead generation. |
Where Do You Find Industry-Specific Numbers?
Two places cover almost every industry: IBISWorld’s free summary pages (market size, growth rate and key stats per industry — enough for a pitch deck without the paid report) and the ABS Australian Industry release (income, expenses and employment by industry, annually). Then go narrower:
| Industry | Where to look |
|---|---|
| Any industry | IBISWorld Australia free summaries; ABS Australian Industry |
| Hospitality & tourism | Tourism Research Australia (tra.gov.au) visitor surveys by region; free hotel outlook reports from CBRE and Colliers |
| Construction & trades | Xero SBI splits construction out; HIA and Master Builders forecasts are summarised free in media releases |
| Real estate | CoreLogic, Domain and PropTrack all publish free monthly housing reports |
| Health & wellbeing | AIHW (aihw.gov.au) — free government health data and reports |
| Food & grocery retail | NAB Online Retail Index and Australia Post both split out food and liquor categories |
How Do You Keep Up With AI Adoption Trends?
Three sources, none of them hype. The Anthropic Economic Index publishes real usage data on how AI is applied across occupations (with open datasets). Microsoft’s Work Trend Index tracks adoption inside workplaces. And OpenAI’s research blog publishes periodic usage studies like “How People Use ChatGPT”.
Why does this belong in a marketing reference list? Because your customers’ buying journey increasingly runs through AI assistants, and these reports tell you how fast that’s happening in your sector. It’s the same shift behind our SEO & AEO service — being findable when an AI is doing the searching.
How Often Should You Actually Check These?
Don’t try to read everything — you’ll do it once and never again. In our experience a three-tier habit is what sticks: a monthly pulse from three sources, a quarterly check, and a proper annual review when the big reports land.
Two housekeeping tips.
The Sensis/Yellow Social Media Report is discontinued — its last edition was 2020, so treat any stats from it as historical and use DataReportal instead. And for the “free with email” reports (HubSpot, Salesforce, Adobe, Meltwater), sign up with a shared team address so the sales follow-up doesn’t land in anyone’s personal inbox.
Turning Free Data Into a Marketing Plan
Data doesn’t make decisions — it makes your decisions defensible. We use these sources to answer four questions for every client: which channels deserve budget (DataReportal), when to push and when to hold (bank sentiment and spending trackers), which categories are moving (NAB and Australia Post), and how we’re tracking against the industry (Xero SBI).
If you’d like that thinking applied to your business, our free discovery session is exactly that: your goals, your market’s data, and a straight answer on where we’d start. You can also see how we put research to work across our digital marketing services.
Frequently Asked Questions
What replaced the Yellow Social Media Report for Australian data?
DataReportal’s annual Digital Australia report (published with Meltwater and We Are Social) is the best free replacement. It covers Australian internet, social media and device usage in depth, refreshed annually each February with quarterly updates in between.
Are these resources genuinely free?
Yes. Government sources (ABS, AIHW, Tourism Research Australia), bank trackers and DataReportal are open access. A handful — HubSpot, Salesforce, Adobe and Meltwater reports — are free but gated behind an email form. IBISWorld’s full reports are paid, but its free summary pages carry the headline numbers.
What’s the single best source for Australian ecommerce data?
The Australia Post eCommerce Report. It’s built on actual parcel-delivery volumes rather than surveys, broken down by category, generation and location, and it’s free. Pair the annual report with NAB’s monthly Online Retail Sales Index to catch category shifts between editions.
How do I use this research without a marketing team?
Follow the cadence chart above: three monthly sources, one quarterly, a short annual review. Fifteen minutes a month answers the practical questions — is my category growing, is consumer confidence up or down, and am I keeping pace with my industry’s benchmarks?